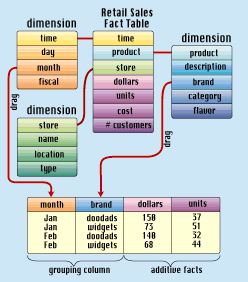
In data warehouse applications we often talk about drilling down, and occasionally we talk about reversing the process and drilling up. In the last year or two these techniques have been extended, and many data warehouse designers are talking about drill ing across and even drilling around. All of these are useful, distinct concepts, but it is time for us as an industry to be more consistent and more precise with our vocabulary. This article shows exactly what each of these drilling terms means.
From the above discussion you can see that the precise definition of drilling down is "add a grouping column." A few query tool vendors have tried to be overly helpful and have implemented a drill down command in their user interfaces that adds specific grouping columns, usually from the "product hierarchy." For instance, the first time you press the drill down button, you add a category attribute. The next time you use the button, you add the subcategory attribute, and then the brand attribute. Finally , you add the detailed product description attribute to the bottom of the product hierarchy. This is very limiting and often not what the user wants. Not only does real drill down mix both hierarchical and nonhierarchical attributes from all the availabl e dimensions, but there is no such thing as a single obvious hierarchy in a business in any case.
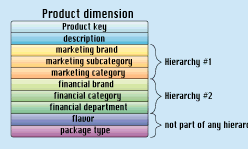
It may happen that there is more than one well-defined hierarchy in a given dimension. In some companies, marketing and finance have incompatible and different views of the product hierarchy. Although you might wish that there was only a single product h ierarchy, all of the marketing-defined attributes and all of the financially defined attributes are well defined in the detailed master product table. (See Figure 2.) The user must be allowed to traverse any hierarchy and to choose unrelated attributes that are not part of the hierarchy.
Large customer dimension tables often have three simultaneous hierarchies. If the grain of the customer table is the ship to location, you automatically have a geographic hierarchy defined by the customer's address (city, county, state, and country). You probably also have a hierarchy that is defined by the customer's organization, such as ship to, bill to, division, and corporation. Finally, you may have your own sales hierarchy that is based on assigning sales teams to the customer's ship to's. This s ales hierarchy could be organized by sales territory, sales zone, and sales region. A richly defined customer table could have all three hierarchies happily coexisting, and awaiting all possible flavors of end-user drill down.
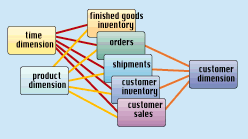
A drill across report can be created by using grouping columns that apply to all the fact tables used in the report. Thus in our manufacturing value chain example, attributes may be freely chosen from the product and time dimension tables because they ma ke sense for every fact table. Attributes from customer ship to can only be used as grouping columns if we avoid touching the finished goods inventory fact table. When multiple fact tables are tied to a dimension table, the fact tables should all link to that dimension table. When we use precisely the same dimension table with each of the fact tables, we say that the dimension is "conformed" to each fact table. Dimensions that are not conformed (such as those that differ in grain or detail) across fact tables will defeat the drill across application.
After building the grouping columns and the additive fact columns, you must launch the report's query one fact table at a time, and assemble the report by performing an outer join of the separate answer sets on the grouping columns. This outer join must be performed by the requesting client tool, not the database. You must never try to launch a single SQL SELECT statement that refers to more than one fact table. You will lose control of performance to our friend, the cost-based optimizer. This is Kimbal l's Law for data warehouse queries, and will be the subject of a future column. Note that the necessary outer join assembles the final report, column by column. You cannot solve this with SQL UNION, which assembles reports row by row.
Some of you may be wondering why each business process is modeled with its own separate fact table. Why not combine all of the processes together into a single fact table? Unfortunately, this is impossible for several reasons. Most important, the separat e fact tables in the value chain do not share all the dimensions. You simply can't put the customer ship to dimension on the finished goods inventory data. A second reason is that each fact table possesses different facts, and the fact table records are recorded at different times along the value chain.
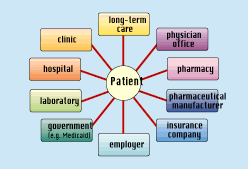
Once you have set up multiple fact tables for either drilling across or drilling around, you can certainly drill up and down at the same time. In this case, you take the whole value chain, or value circle, and simultaneously ask all the fact tables for m ore granular data (drill down) or less granular data (drill up).
The Star Tracker software distributed on the DBMS Buyer's Guide CD-ROM in January is capable of all of the forms of drilling discussed in this article. This software is also available via my home page on the web, at http://www.rkimball.com.


