An interesting design theme that has come up in many data warehouses I have designed is the business application where a person or a thing goes on a voyage. Although ship voyages come to mind most readily, I am really talking about any situation where the person or thing travels from a beginning to an end with some stops in the middle. There are many examples of voyage situations: ocean container cargo shipping, ocean cruises, airline passenger travel, airline cargo shipping, rail transport, truck transport, package delivery services, United States mail (any postal system, really), distribution systems, material movement systems, business-travel credit-card tracking (including car rentals and hotel stays), and, surprisingly, telephone company network-inventory tracking (all of the switches and lines in the network).
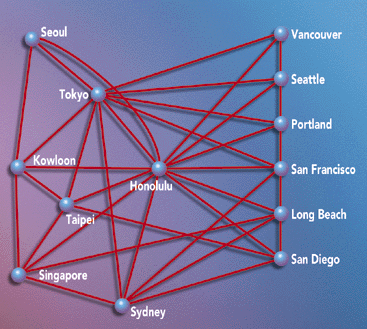
All of these voyage situations can be thought of as networks. The network is the map of every possible voyage between ports. (See Figure 1.) Although it took a while to dawn on me, the design issues for network-oriented business data warehouses are often the same as the design issues for classic voyage data warehouses. Think about the telephone company network inventory example as a map of the possible voyages a telephone call could make between an origin "port" telephone number and a destination port telephone number.
To understand this dilemma and see how to fix it, suppose that you want to build a frequent-flyer data mart for the marketing department at a major airline. Using the methodology described in my DBMS column of December 1996, first choose the business process for this data mart. The business process is the system for generating passenger tickets. You will extract directly from the production ticketing system into the frequent-flyer data mart. The second step is to decide on the "grain" of the main fact table in the star schema. The grain of a fact table identifies the exact context of a fact table record.
In voyage databases, it is inevitable that the grain of the fact table must be the individual voyage segment taken. In the frequent-flyer case, this means that there is a record in the main fact table for each segment flown by a frequent flyer. You must use the segment as the grain, because all of the interesting information about what happened to the frequent flyer is uniquely available at the segment level. This information includes the origin airport for the segment, the destination airport for the segment, the fare class flown, whether an upgrade was purchased or claimed, the type of aircraft, the location of the passenger's seat, whether the flight was late, whether the service was satisfactory, the actual miles flown, and the miles awarded.
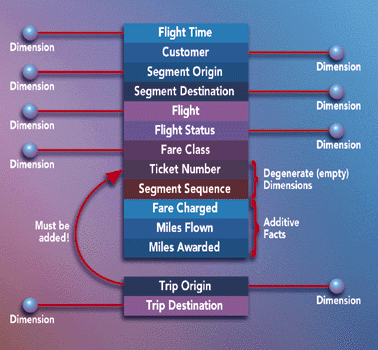
The third and fourth steps in the design are deciding on the specific dimensions and facts. It is fairly easy to arrive at the design shown in Figure 2. At first glance, this design seems to be very satisfactory. The dimensionality is very clean and obvious, and it seems that there would be many useful "entry points" into this fact table through the dimension tables that would let you construct all sorts of interesting business queries.
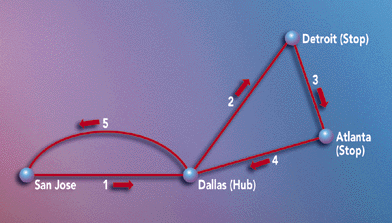
Strangely enough, this schema fails miserably. It is nearly impossible for marketing department end users to ask why the frequent flyers bought a ticket in the first place! The grain of the individual segment masks the nature of the voyage. On a real business flight shown in Figure 3, I may leave from San Jose and fly to Detroit with an intermediate hub transfer stop in Dallas. After staying in Detroit for two days, I go on to Atlanta. Then I return to San Jose, again though Dallas. My five segments look like:
Fortunately, there is a simple solution to his dilemma. If you add two more airport dimensions to Figure 2, suddenly the design becomes very responsive to the end users. These added dimensions are shown with the arrow in Figure 2. These new TRIP_ORIGIN and TRIP_DESTINATION dimensions can be thought of as providing the context for the voyage segment. Now the marketing end users can perform a simple SQL query such as
Select count(distinct ticket_number) ...
Where TRIP_ORIGIN = 'San Jose' and TRIP_DESTINATION = 'Detroit'.
The TRIP_ORIGIN and TRIP_DESTINATION dimensions are identified during the production data extract process. An airline would normally identify a stopover of more than four hours as a meaningful stop at a destination. While the ticket is being processed during the data extract, the TRIP_ORIGIN and TRIP_DESTINATION are easily identified and entered as fields on the individual segment records.
The theme of providing two additional "context" dimensions for the voyage segment is the secret of the voyage and network schema designs. All of these schemas need these two additional dimensions. Armed with these two additional dimensions, end users can ask many interesting questions, including:
The four airport dimensions must be logically independent in this design so that they can be constrained in random and uncorrelated ways. However, you only need to build a single physical airport table to support all four logical dimensions. Although the SQL SYNONYM construct will work to create the illusion of four independent logical tables, the SYNONYM approach by itself is awkward for the end users. The four independent logical tables will end up having identical field names. This makes report building and ad hoc querying confusing. The field called AIRPORT_NAME would be found in all four logical tables, and it becomes cosmetically difficult to tell the four roles apart. A better approach might be to also define four SQL views on these four SYNONYMS, where each view relabels all the fields to names such as TRIP_ORIGIN_AIRPORT_NAME and TRIP_DESTINATION_AIRPORT_NAME.
Voyage schemas often have a large number of dimensions. A schema for a container shipping business could easily have 12 or more dimensions, such as original shipper, ultimate consignor, foreign consolidator, domestic consolidator, carrier, voyage origin, voyage destination, segment origin, segment destination, commodity shipped, container vessel, and bill of lading number (degenerate).
The first five of these dimensions are commercial business entities that play roles in shipping the commodity from the original shipper to the ultimate consignor. Like the airport dimension in the previous example, these five dimensions could be implemented in a single commercial entity physical table, but five SYNONYMS and five SQL views should be used to separate the five business roles.
Even an ordinary relational database can support extensions to maps and graphic images. For graphic images, the name of a JPEG file in the dimension record for the aircraft or the airport is enough for an application to open the image while using the database. I have frequently added graphic images to my queries using Visual Basic just by passing the JPEG file name to the ImageMan Visual Basic plug-in routine. ImageMan handles many different graphic image formats seamlessly; the images really liven up the analysis. ImageMan is available from Data Techniques Inc. of Burnsville, N.C. (www.datatech.com).
Similarly, latitudes and longitudes can be passed to mapping software, which can display a map in a window alongside the query results. In Visual Basic I would take a look at ESRI's MapObjects routines for map generation. ESRI's well-designed Web site is found at www.esri.com.


