![]()
By Roger Snowden
OReview, January/February 1997
In part one of this 3 part series, Roger shows you some of the things you should be tuning in your application and why.
A system is no faster than its worst bottleneck. Performance tuning has always been a process of finding and relieving bottlenecks. The difficulty of tuning contemporary client/server implementations is that we are dealing with unprecedented complexity, even with fairly trivial applications. Not only are we breaking application logic into components distributed over a network that often spans multiple business units separated by hundreds or thousands of miles, but those applications are often event-driven. Moreover, we often create applications using multiple programming languages.
Now is a perfect time to worry. Client/server technology has finally gained acceptance in the corporate information mainstream to the point of resembling the gold rush of the 19th century. Although this model of distributed processing was viewed with more than a little skepticism only a few years ago, mainframe shops today cannot get to client/server fast enough. This sudden popularity has created a situation in which applications are being slapped together by people who often have little experience or whose experience is inappropriate to the task at hand. Many shops are so desperate for developers, and management is so thin where hands-on experience is needed, that people are often placed in critical positions straight out of school, with only a modicum of qualified supervision. Those with programming experience are often simply those mainframe diehards with whom management is most familiar, perhaps with no client/server experience at all.
Much has been written about the tuning of database engines, particularly Oracle. Many sources refer to application tuning as an integral component of the performance-tuning process, even attributing the majority of potential performance gains to the application tuning process. Nobody seems to want to define application tuning, however, much less describe the process. In this three-part series, I provide an overview of that process. In this first part, I discuss bind variables and how Oracle processes Structured Query Language (SQL) statements, index selectivity, Oracle's optimizer technology, and parallel queries. In Part 2, I continue with a discussion of selected SQL techniques, application partitioning with stored procedures and triggers, and index management techniques. Finally, in Part 3, I conclude with transaction management, locking strategies, and a discussion of client/server design considerations.
I define application tuning as those performance enhancement activities that cannot be performed by DBAs alone. This includes not only coding techniques and application program design but also the manner in which the application interacts with the relational DBMS itself, beyond simple SELECT statements. Moreover, to ensure a beneficial result, some knowledge of the inner workings of the database engine is essential for application developers. We cannot escape this, although it is not realistic to expect all client/ server developers to have knowledge that compares to that of a qualified DBA. Application tuning must be a cooperative effort.
All too often, application programmers enter the client/server world with the idea that SQL is simply a messaging language, a way of sending and receiving data. Many high-level client tools generate SQL language statements for you. You can create an entire application without actually knowing or coding the SQL language itself. At the other extreme, those same tools often have commands such as "DBPassThrough" or "Execute Immediate" that let you not only write your own SQL statements but pass those statements directly to the database engine without evaluation or intervention, however inefficient your code might be. Regardless of your particular tool's SQL handling features, once you understand the DBMS engine's way of processing the language, your own perception of SQL can never be the same.
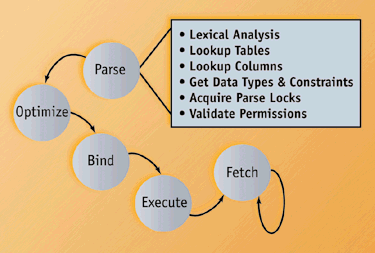
SQL is passed to the DBMS engine as human-readable text. The engine must parse that text message in order for it to be interpreted and executed. One DBA friend recently suggested that, for Oracle, parsing is insignificant. I decided to conduct a test to find out. I used a simple INSERT statement and found that the parsing process accounted for about half of the response time of the insertion! The results were proportionally the same across multiple operating systems, Oracle versions, and CPU architectures. When you consider the work that must be performed before rows can be retrieved, this should come as no surprise.
First, the statement itself must pass lexical analysis, just to ensure that it is a correctly formed SQL statement. In addition, Oracle must evaluate and look up table names in its internal data dictionary to ensure that they are valid. Then Oracle consults its dictionary to ensure that the individual columns are valid and to ascertain the data type and constraints on each column. "Parse locks" prevent all of these parsed elements from changing during the parsing process. Next, Oracle validates permissions by checking its internal tables to make sure that the user has permission to perform the operation. Finally, the database engine creates an execution plan, based on either the "rule" or the "cost" optimization method. With the cost-based optimization technique, Oracle examines internal statistical data and looks for the presence of indices and other structures to determine how to best fetch the rows. Cost-based optimization became available in Oracle7; prior to Oracle7, only rule-based optimization was available. Rule optimization based its execution plan on the contents and structure of the SQL statement itself rather than using statistics about the affected database objects. Even with a trivial SQL statement, the Oracle engine must perform a huge amount of work before it can select the first row of data. (See Figure 1.)
Fortunately, most relational database engines are capable of recognizing and reusing SQL statements that have previously been parsed. This feature is known as "shared SQL," and Oracle stores this information in its library cache. Oracle calculates and stores a hash value for every statement it sees. If that exact statement is seen again, and the parse information is still in memory, Oracle goes directly to execution and saves much of its own overhead. The key word here is "exact." The SQL statements are case-sensitive, so even capitalization must be consistent. Spacing, too, must be identical. Oracle is looking for an ASCII string that matches perfectly, regardless of its context. Because most SQL is emitted by the same client programs, consistency of case and white space is usually not difficult to manage. What does matter in all cases is that a WHERE clause is present. Consider the obvious problem with:
SELECT * FROM customers WHERE customer_number = 100;
SELECT * FROM customers WHERE customer_number = 212;
These two statements are not identical because the values 100 and 212 are hard-coded and not the same. When Oracle sees these statements, it calculates the hash value mentioned above, which equates to a different value for each of the statements. Because the hash values are not the same, they do not qualify as shared SQL, and so Oracle must parse each statement anew, determining a distinct execution plan for each. The only difference between the two statements is the value in the WHERE clause, so the execution plan will be identical anyway. Thus Oracle performs a lot of work for nothing. Fortunately, Oracle provides a mechanism to handle this situation.
When SQL statements have variables, they may be substituted using placeholders. Such variables are called host variables or bind variables. Modifying the previous example, the bind variable method would be:
SELECT * FROM customers
WHERE customer_number = :custnum
:custnum is sent to Oracle and the value "100" or "212" is passed as a separate parameter. Oracle then sees the SQL statement as identical each time it is passed, uses the existing execution plan, and simply substitutes the current bind variable value to fetch the appropriate row(s). Note that the bind variable itself must also be identical in each statement that is to be shared.
Most client tools use bind variables as a matter of course, to the extent that many programmers are not even aware of them. Thus when it becomes necessary to create SQL manually, the matter of bind variables is often overlooked. Of course, SQL statements that do not include variable data, such as COMMIT WORK or ROLLBACK, can be passed through directly without concern, as long as case and spacing are respected.
In Powersoft's PowerBuilder, prior to release 3, the syntax of bind variables was supported for directly executed SQL, but the interpreter performed the substitution on the client side and sent the fully formed constant string to the database. Only in the case of SQL emitted by PowerBuilder's DataWindows object are bind variables sent to the DBMS. But in the case of hand-coded SQL, each statement tends to be unique and parsing overhead is high. You may not even notice this problem until deployment time, when it is too late. So it is important for application developers to understand what goes on inside the database engine as well as the client tool.
The parse information and SQL statements reside in Oracle's library cache. As with other cache areas, SQL statements are held and flushed according to a least-recently-used (LRU) algorithm. If virtually every SQL statement is unique (because bind variables are not used), this cache area will be constantly flushing out statements. No reuse will occur in this situation. Normally, this cache is considered the domain of the DBA and is modified as a part of the database tuning process. If, however, bind variables are not used by the application developer, there is nothing the DBA can do to improve performance. The developer and administrator must work together to achieve optimal performance.
PL/SQL stored procedures, functions, and triggers all reside in the library cache, along with the shared SQL I discussed earlier, which is part of the shared pool. The shared pool is a general cache area that contains many types of cached objects. To use caching efficiently, consider using PL/SQL packages (I will discuss these in greater depth in Part 2 of this article). A package is a method of associating multiple procedures and functions in a common area with a common interface definition. Besides facilitating function and procedure overloading, it has significance for the library cache.
When a function or procedure contained in a package is called, the entire package is loaded into cache. That means that related logic can be parsed and cached at one time, saving parse time and sudden performance hits later. This feature helps avoid discomfort on the part of users, so consider it as you design server-based logic.
You can prevent procedures from aging out of the shared pool (more specifically, the library cache) by using the DBMS_SHARED_ POOL package. This is a collection of functions that, when run, keep procedures and functions from being flushed by the LRU algorithm for the life of the session. It is especially useful for situations in which logic is used repetitively and you want to ensure that there are no sudden, seemingly random slowdowns with the application. Oracle can slow down noticeably when a lot of procedures are aging in and out of a small library cache and procedures must be reloaded. Reloads are expensive. If the library cache is small and procedures keep aging out and getting reloaded, memory may become fragmented. In versions of Oracle7 prior to 7.3, this can cause application errors when the procedure cannot be reloaded. The DBMS_SHARED_POOL package can prevent this.
The process of forcing a procedure to remain in memory is called "pinning." You use the DBMSPOOL.SQL script that comes with Oracle7 to create the DBMS_SHARED_POOL package. Then an application can call the procedure DBMS_SHARED_POOL.KEEP( ) to pin an object in the shared pool. Once a qualified object, such as a SQL statement, package, or procedure, is "pinned" in memory, it will not age out of the shared pool for the rest of the life of the instance, or until the application "releases" it with the DBMS_SHARED_ POOL.UNKEEP procedure. The KEEP and UNKEEP procedures work with shared SQL statements, procedures, functions, packages, and cursors. In this context, the term "cursor" refers to pointers to session-specific information, such as bind variable values, that makes shared SQL meaningful for each user's SQL execution.
To learn more about parsing and to view the effect of bind variables, look at the output of the SQL_TRACE facility that Oracle offers. The location of the trace output file is indicated by the init.ora parameter USER_DUMP_DEST. The trace output file is processed by a utility called "tkprof," which is executed from the server's operating system command line. The output of tkprof is readable text.
To turn on SQL tracing, you have two options. You can enable SQL tracing instance-wide for all sessions by setting the init.ora parameter SQL_TRACE=TRUE. However, be aware that when tracing is enabled for all sessions, a performance hit is likely. An alternative would be to enable tracing for a particular development session using an ALTER SESSION SET SQL_TRACE=TRUE statement. (For more information on SQL_TRACE and tkprof, see Guy Harrison's article, "Getting the Most from the SQL_TRACE Facility," in the Winter issue.)
SQL_TRACE involves considerable overhead of its own, but its output optionally includes EXPLAIN PLAN output and can be quite instructive. Notice the amount of SQL that Oracle itself generates as a result of the parse process, and you can get an intuitive appreciation for the importance of bind variables and the cost of parsing. Those internally generated statements are called "recursive SQL." You may also notice that those recursive SQL statements make use of bind variables.
Selectivity of an index refers to the number of data rows to which each index entry points. Higher selectivity means fewer rows per index entry, which is good for any transaction processing environment. A typical OLTP application SQL statement operates on relatively few rows at a time. If an index can point to precisely the rows you want, Oracle can accurately construct an access plan to get only those rows via the shortest possible path. In decision-support and reporting systems, selectivity is less important because you are often accessing all of a table's rows. In such situations, full table scans are common and indices are not even used.
The most selective index possible is the one associated with either a primary or unique index, where exactly one data row exists for each index entry. When selectivity is extremely poor, so many data rows are selected per key value that the database may decide that a full table scan is cheaper to use than an index. In such cases, it is better not to bother building an index. Allowing frequent sorts to occur in a large-scale transaction-processing environment, however, can bring Oracle to its knees.
Most contemporary DBMS engines come with utilities to calculate index selectivity. They typically work with the internal dictionary tables that store the statistics used internally by the database engine. Oracle comes with a pair of scripts for calculating and reporting index selectivity: UTLOIDXS and UTLDIDXS. You run each, passing table names and column names as parameters, and get two reports. The reports provide statistics about key uniqueness and a factor that Oracle calls "badness," which refers to the selectivity of a column and is helpful in determining its usefulness as an index. This tool is most helpful in determining the usefulness of alternate (non-primary) key indices. You can choose a more selective column for your index (if appropriate for your SQL logic), concatenate columns to increase index selectivity, or simply eliminate the index altogether. Listing 1 shows an example using a single column for a proposed index.
For the table EQUIPMENT, the NODE column has a "badness" factor of 6 for 81.66 percent of the 169 rows in the table; 10.65 percent of the rows have a badness factor of 3. The badness factor of 1 that applies to 7.69 percent of the rows means that those key values point to exactly one row of data. Overall, this index is fairly selective, because each key value points to an average of 4.02 rows. If you want to improve its selectivity, however, you can concatenate two columns and run the utility as shown in Listing 2.
Notice that the column name parameter includes both columns, enclosed with single quote marks and separated by Oracle's pipe symbol "||" double vertical bars. Although the utilities' documentation states that multiple column indices are not supported, this technique works perfectly well to evaluate the suitability of concatenated column indices. In this case, the combination of NODE and BRIDGE happens to refer to the table's primary key, which is unique. Therefore, it has a badness factor of 1 for 100 percent of the table's rows. You can't get any more selective than that. Experiment with this utility and try various combinations of columns to get the selectivity you need to help your application to avoid full table scans.
A full table scan is not necessarily an unwanted thing, however. If a table is small enough to fit its rows inside a few data blocks, you might omit most indices on the table, except those that you need to enforce referential integrity or uniqueness. I have seen instances of tables that have half a dozen columns, fewer than 10 rows, and three or more indices. Often the indices were simply permutations of the same columns. Apparently the designer of these tables imagined that queries would be performed with differing ORDER BY clauses and that such indices would drive the query and somehow be more efficient. When a table is small, Oracle will not even bother with an index. It will simply grab all of the rows and sort them in memory. Other than to enforce a constraint on an individual column, such an index is a complete waste of time and space.
The fact that small tables are normally scanned fully leads me to an important feature of Oracle7 release 7.1 and later. Using the ALTER TABLE . . . CACHE command, you can force Oracle to store rows retrieved from a full scan of a table at the most recently used end of the buffer cache, which means that the entire table will be held in cache, probably for the life of the instance. This is quite useful for small lookup tables that are frequently referenced by client applications. For instance, in order to cause the table CUSTOMERS to be held in cache, use the following syntax:
ALTER TABLE CUSTOMERS CACHE;
When you build a concatenated (or compound) index, you must understand that the left-most column must be the most selective in order for the index to work efficiently. Sometimes columns are specified in backward order. If a parent-child relationship exists, the primary key of the child consists of the primary key of the parent, concatenated with another column of the child. For example, in a typical order-processing system, the ORDER_DETAIL table might be a child of the ORDERS table. The primary key of ORDERS is OrderNumber. The primary key of the child might be the concatenation of OrderNumber + LineItem. In our example, LineItem is a range of integers from one to the maximum allowable number of actual line items -- say 99. If the primary key is specified backward, as in LineItem + OrderNumber, then any query that has OrderNumber specified in its WHERE clause will invoke a full table scan each time, without exception. This example is deliberately trivial to make the situation obvious, but many situations occur in which column ordering is not so obvious.
A more likely example involves the use of status codes. Sometimes an index is created with some form of status code as the left-most column, usually a single-byte CHAR or VARCHAR column. The intent is to select all rows with one particular status value only. I recently encountered a table that had over 300,000 rows and only three distinct values for Status. Only one value was ever selected, which resulted in a full table scan each time because a huge percentage of rows were affected. This result was probably not what the designer had in mind. Poor index selectivity can cause full table scans if Oracle's optimizer decides that a full table scan is the cheapest route. In the second part of this series, I describe index techniques to address this situation. I discuss the optimizer later in this article.
Unfortunately, the exact circumstances under which Oracle will perform a full table scan are not perfectly clear. Some authorities suggest that it will do so any time a DBMS determines that it will access more than 20 percent of the rows in any table. Application developers often use that number as a rule of thumb, but it can be misleading. The actual determination is based on the number of blocks accessed vs. the total number of blocks in a given table. Oracle's cost-based optimizer uses table statistics to drive its formula. Those statistics are generated by the ANALYZE TABLE command and are normally under the control of the DBA. Because they enable Oracle to accurately determine row and block counts, table statistics should be updated on a regular basis, as well as whenever a known major change in table size occurs.
Oracle is continuously improving its product. As such, the specific behavior of its optimizer varies from version to version. Oracle does not specify how its cost-based optimizer will behave at any release level, only that it will vary with each new release. The only way to predict Oracle's treatment of any particular SQL statement is to use the EXPLAIN PLAN facility, which I describe in more detail later in this article. EXPLAIN PLAN permits you to determine exactly how Oracle will process a specific SQL statement for a given database instance. If you use the EXPLAIN PLAN facility on your key SQL statements before you migrate to a new release, you can determine if the optimizer is behaving differently for that statement and adjust your SQL accordingly. You can also exert some control of Oracle's behavior with optimizer "hints," which I also describe in more detail later in this article.
Virtually every relational DBMS on the market today -- including Oracle7 -- has some form of cost-based optimizer. The optimizer's role is to evaluate the SQL statement offered to the DBMS and create an execution plan that yields the best result based upon certain assumptions. Most DBMS engines use pretty much the same conceptual approach when developing the execution plan. Specific techniques and assumptions vary, but most approaches are based on statistics gathered from the actual database objects on which the SQL operates. The cost-based method became available with Oracle7.
Oracle version 6 uses a rule-based method based on certain generalized assumptions. For example, it assumes that an index is always better to use than a full table scan. Of course, this is not always true. As I discussed earlier, the size of a table has a profound impact on the usefulness of an index, and the rule-based method ignores table size. The cost-based method is generally better than the rule-based technology because the optimal access path is dynamically determined based upon actual table and index characteristics. Rule-based optimization is still maintained in many shops, however, because Oracle's cost-based technology is still a moving target. That is, the cost-based optimizer will not necessarily behave the same way from one release to another because it is relatively new technology and is being improved regularly. One virtue of the rule-based approach is that the execution plan is determined by a fixed, hierarchical set of rules and not by the state of the database objects themselves and is therefore entirely predictable. The best way to decide which method to use is to try your SQL both ways and use the EXPLAIN PLAN facility to see which works best for your application.
Regardless of the optimization method you choose, no optimizer is perfect. Ultimately, the responsibility for performance is yours. Fortunately, Oracle provides a means to override the optimizer manually and take control of the execution plan with "hints," a means by which the execution plan of a SQL statement is controlled by the SQL statement itself. An optimizer hint is a syntax addition to a SQL statement that is actually embedded in a comment string. This technique usually hides the Oracle-specific syntax from other DBMS engines in cases for which SQL is intended to be portable. Hints are quite easy to implement, but they require some understanding in order to use their power wisely. Hints are especially important to study because your knowledge of your particular database is more important that any algorithmic assumptions made by the optimizer. Moreover, you can test and adjust the behavior of SQL statements and the effects of hints by using the EXPLAIN PLAN facility. Following is an example of a SQL statement containing a hint that requests a full table scan:
SELECT /* FULL */ name, customer_number
FROM customers WHERE sales_rep > 100;
Notice that the hint text FULL is enclosed in comment delimiters. Many options are available for optimizer hints, including requests for a specific index, strategies for join operations, and forcing retrieved rows to be held in the "most recently used" end of the data cache, in the same manner as the ALTER TABLE ... CACHE statement I described earlier. (For a detailed discussion of optimizer hints, see page 43 of Steve Bobrowski's article "Tuning Application Logic" in the summer issue of OTJ.)
Don't trust the optimizer blindly. For all of the sophistication of cost-based optimization, Oracle sometimes makes a bad decision. For example, the optimizer might decide to use an index for a particular join in a case for which a full table scan is actually better. By embedding the appropriate hint in the SQL statement, you can force Oracle to perform the full table scan regardless of what its optimizer decides.
In another case, you might be performing a join that involves a nested loop. In a nested loop operation, Oracle selects appropriate rows from one table, and then for each of those rows a SELECT is performed against another table where indexed column values match. That is, for a single value of the driving table, Oracle selects multiple rows of the joined table that match key values, as in a parent-child relationship. For each CustomerNumber in the Customers table, you select all Orders that match that CustomerNumber. Nested loops are typically faster when the table with the smaller set of rows is the driving (outer) table of the loop. Normally, Oracle makes good decisions about nested loops, but complex SQL can throw it off. On its own, Oracle might well choose the large table as the driver, ruining performance. You can use an optimizer hint to force this to happen the way you decide.
If you have the appropriate test facilities, the surest way to discover Oracle's behavior is to use its EXPLAIN PLAN facility on the target or production database. The EXPLAIN PLAN command uses a table called PLAN_TABLE to store its output. Syntactically, the EXPLAIN PLAN command contains the SQL statement that is being analyzed. A specialized query is then run to create a short report from the plan table that describes Oracle's proposed access path for the query.
Oracle's execution plan is based on the statistics available in the database instance to which it is connected, so you really must have available either a production database or a reasonable replica to make good use of EXPLAIN PLAN. Included in the plan analyzer's output is a relative cost number. If this number has a specific meaning, it is a well-kept secret. Instead, you should regard it as an indication of relative cost. Execute the statement one way to see the cost, then change the statement and see if the cost goes up or down.
Sometimes the output of the EXPLAIN PLAN facility can be cryptic. Moreover, it requires a rather esoteric SQL statement to get the output to your screen. Oracle's documentation on the subject is reasonable and is currently contained in Appendix A of the Oracle7 Server Tuning manual. Prior to version 7.3, the documentation was contained in Oracle's Application Developers Guide. (For a detailed discussion of EXPLAIN PLAN [with examples], see page 39 of Steve Bobrowski's article "Tuning Application Logic" in the summer issue of OTJ.)
The Parallel Query Option is sometimes confused with the Parallel Server. They are distinct, separately licensed options that have little to do with one another. The Parallel Query Option, or PQO, is a feature that enables Oracle to perform full table scans quickly. Sometimes, especially in heavy reporting environments, full table scans are necessary and desirable. But you still need them to execute quickly, so Oracle lets you break a query into chunks and spread the work among multiple query processes.
This feature is particularly useful in all multiprocessor systems, including SMP, clustered, and MPP systems, because the query processes make effective use of parallel CPUs. When RAID (redundant array of independent disk--a parallel disk-storage technology) and disk striping technology are included, full table scans complete in a fraction of the time of the traditional approach. The PQO must be installed by a DBA--you cannot simply flip a switch and turn it on. The DBA can specify a default degree of parallelism for each instance as well as for each table. If a table has no specific degree of parallelism set up, the instance default is used by the "query coordinator" processes that manage PQO operations. Moreover, an optimizer hint can be employed to override the defaults for a specific SQL statement. When Oracle's Multi-Threaded Server (MTS) option is also installed, the PQO is especially potent. The MTS enables Oracle to use shared processes among multiple users and provides for automatic load balancing in SMP environments.
Even with its power, the PQO is a highly specialized option and must not be implemented casually. It is still inappropriate to mix transaction with batch processing, and using the PQO implies batch operations, particularly decision-support applications such as data warehouse systems. Remember, the PQO applies to full table scans only. If your application requires a mix of transaction and batch processing, you may want to use a separate database for each type of work. As a general rule, most relational databases work best when they are either transaction- or batch-oriented, not a mixture of the two. If you wish to consider offloading batch work to a separate machine, a number of techniques are available to quickly move data from one machine to another while still keeping information current and synchronized on both. To address these issues, I discuss distributed transactions and replication in Part 3 of this series.
As this series continues, I discuss SQL tuning further. In Part 2, rather than attempting to provide a tutorial for advanced SQL, I offer a discussion of specific techniques available to developers to enhance performance when and where appropriate. I also discuss index issues and application partitioning (the process of migrating application logic between the client and the server using stored procedures and triggers). In the final part of this series, I present an overview of performance from the perspective of architectural and design considerations, including transaction management, locking strategies, and a look at distributed databases and multitier architectures.
--Steps involved in parsing ans SQL execution.
SQL> start utloidxs equipment node | |||||
EQUIPMENT NODE | |||||
SQL> start utldidxs equipment node | |||||
TAB_NAME |
COL_NAME | ||||
------------------------------- |
------------------------------- | ||||
EQUIPMENT |
NODE | ||||
TABLE_NAME |
COLUMN_NAME |
STAT_NAME |
STAT_VALUE | ||
--------------- |
--------------- |
------------------------------ |
------------- | ||
EQUIPMENT |
NODE |
Rows - Null |
0.00 | ||
EQUIPMENT |
NODE |
Rows - Total |
169.00 | ||
EQUIPMENT |
NODE |
Rows per key - avg |
4.02 | ||
EQUIPMENT |
NODE |
Rows per key - dev |
2.29 | ||
EQUIPMENT |
NODE |
Rows per key - max |
6.00 | ||
EQUIPMENT |
NODE |
Rows per key - min |
1.00 | ||
EQUIPMENT |
NODE |
Total Distinct Keys |
42.00 | ||
EQUIPMENT |
NODE |
db_gets_per_key_hit |
2.74 | ||
EQUIPMENT |
NODE |
db_gets_per_key_miss |
5.30 | ||
TABLE_NAME |
COLUMN_NAME |
BADNESS |
KEYS_COUNT |
ROW_PERCENT |
KEY_PERCENT |
| -------------- | --------------- |
---------- |
---------- |
----------- |
------------ |
EQUIPMENT |
NODE |
6 |
23 | 81.66 | 54.76 |
EQUIPMENT |
NODE |
3 | 6 | 10.65 | 14.29 |
EQUIPMENT |
NODE |
1 | 13 | 7.69 | 30.95 |
SQL> start utloidxs equipment 'node | | bridge' | |||||
EQUIPMENT NODE | | BRIDGE | |||||
SQL> start utldidxs equipment 'node | | bridge' | |||||
TAB_NAME |
COL_NAME | ||||
------------------------------- |
------------------------------- | ||||
EQUIPMENT |
NODE | | BRIDGE | ||||
TABLE_NAME |
COLUMN_NAME |
STAT_NAME |
STAT_VALUE | ||
--------------- |
--------------- |
------------------------------ |
------------- | ||
EQUIPMENT |
NODE | | BRIDGE |
Rows - Null |
0.00 | ||
EQUIPMENT |
NODE | | BRIDGE |
Rows - Total |
169.00 | ||
EQUIPMENT |
NODE | | BRIDGE |
Rows per key - avg |
1.00 | ||
EQUIPMENT |
NODE | | BRIDGE |
Rows per key - dev |
0.00 | ||
EQUIPMENT |
NODE | | BRIDGE |
Rows per key - max |
1.00 | ||
EQUIPMENT |
NODE | | BRIDGE |
Rows per key - min |
1.00 | ||
EQUIPMENT |
NODE | | BRIDGE |
Total Distinct Keys |
169.00 | ||
EQUIPMENT |
NODE | | BRIDGE |
db_gets_per_key_hit |
1.00 | ||
EQUIPMENT |
NODE | | BRIDGE |
db_gets_per_key_miss |
1.00 | ||
TABLE_NAME |
COLUMN_NAME |
BADNESS |
KEYS_COUNT |
ROW_PERCENT |
KEY_PERCENT |
--------------- |
--------------- |
---------- |
---------- |
----------- |
----------- |
EQUIPMENT |
NODE | | BRIDGE |
1 | 169 | 100.00 | 100.00 |