DBMS - January 1997

LETTING THE USERS SLEEP, PART 2
Nine Decisions in the Design of a Data Warehouse
In last month's column I began a discussion of how to make sense out of the seemingly impossible task of designing an enterprise data warehouse. The database industry has more or less come to the realization that a divide-and-conquer approach is required. This divide-and-conquer approach is called "data marts." Thus, an enterprise data warehouse is revealed as the union of a set of separate data marts implemented over a period of time, possibly by different design teams, and possibly on different hardware and software platforms.
In last month's article I introduced a nine-step method that in my experience leads to an effective design of an individual data mart. The nine-step method also ties together separate data marts so that over time they merge together into a coherent overall data warehouse. I discussed the first three steps in the method: Step 1: Choosing the Process, Step 2: Choosing the Grain, and Step 3: Identifying and Conforming the Dimensions.
Choosing the process means identifying the subject area of the data mart. I recommend choosing customer billing or customer monthly statements as the first data mart area in many businesses. Choosing the grain means identifying precisely what a single fact table record represents. The fact table is the large central table in all dimensional database designs that contains the numerical measurements of the business. Identifying and conforming the dimensions means deciding what the components of the multipart fact table key are, each of which joins to a single dimension table. Conforming the dimensions imposes the requirement that the same dimension (such as the Customer dimension) in two different data marts be defined in precisely the same way across the two data marts, or that one dimension be a mathematical subset of the other.
The next steps in the process are:
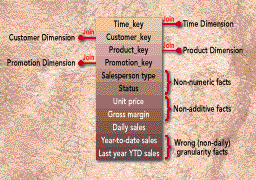
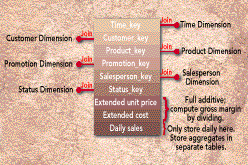
Step 4: Choosing the Facts. The grain of the fact table determines which facts you can use in the data mart. All of the facts must be expressed at the uniform level implied by the grain. In other words, if the grain of the fact table is an individual line item on a customer bill, then all of the numerical facts must refer to this particular line item. Also, as I have said many times before, the facts should be as additive as possible. Figure 1 shows a "bad" fact table with a horrible mixture of non-numeric facts, non-additive facts, and facts at the wrong grain. This design is unusable. Figure 2 shows a "good" fact table in which all of the data elements in the first design have been correctly recast so that they are as numeric and additive as possible.
Notice that additional facts can be added to the fact table at any time, as long as they are consistent with the grain of the table. These additional facts do not invalidate any previously functioning applications. This compatibility is an example of the graceful upward extensibility of the dimensional database design approach. In the August 1996 DBMS, I discussed four different ways in which a dimensional database withstands "assaults" on its design because of new requirements or new data elements. This is one of those four situations. After choosing the facts, study them to see if there are opportunities for the next step.
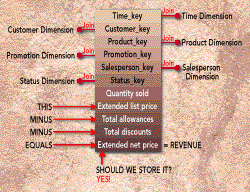
Step 5: Storing Precalculations in the Fact Table. A common example of the need to store precalculations occurs when the facts comprise a Profit and Loss statement. This situation will often arise when the fact table is based on a customer bill. Figure 3 shows the fact table starting off with the Quantity Sold and the Extended List Price. Both are beautiful additive quantities, from which you can always derive the average unit list price after you have added up some number of fact table records. Of course, the customer doesn't usually pay the list price. You need to subtract any discounts and allowances to arrive at the Extended Net Price. Because the Extended Net Price can always be derived from the Extended List Price minus the Allowances and Discounts, do you need to store the Extended Net Price explicitly?
The answer is a resounding YES! This example is complicated enough that if there is even the smallest chance that a user will derive the Extended Net Price incorrectly, then you should put it into the underlying physical schema, even though "it takes up space." The cost of a user incorrectly representing the Extended Net Price -- which, after all, is the primary Revenue number of your whole enterprise -- overwhelms the minor cost of a little redundant data storage. To put it another way, if you have gone to the trouble of creating a dimensional home for a number as important as the Extended Net Price = Revenue, then you should take the final step of actually storing the data even if it can be calculated from adjacent data items. Note that a view that simply calculates the Extended Net Price is somewhat dangerous if there is any chance at all that a user with an ad hoc query tool can sneak around the view to get at the physical table. In the long run, views are a good way to achieve a balance between eliminating user blunders and saving on storage, but the DBA must allow no exceptions to the users always accessing the data through the view.
Step 6: Rounding Out the Dimension Tables. At this point the fact table is complete, and you understand the roles of the dimension tables in providing the entry points into the fact table through constraints on the dimensional attributes. The grain decision in Step 2 has also determined the grain of each of the dimension tables. For instance, if the grain is an individual customer bill line item, then the customer dimension grain is probably the customer bill-to address, and the product/service dimension grain is the lowest level of the product/service hierarchy at which we do billing. In Step 3, you should have identified the dimensions in sufficient detail to describe such things as customers and products at the correct grain, and you should have figured out where you must get the dimension keys.
In this step, you can return to the dimension tables and exhaustively add as many text-like descriptors to the dimensions as you can. In my data mart design consulting, I insist that my IS clients identify a minimum of 50 text-like attributes for such important dimensions as customer and product. Even inherently small dimensions such as Transaction Type should be graced with good text descriptions of what each transaction type means. Chances are these transactions can also be arranged in groups. The Transaction Group should be another text attribute.
All of the text attributes should consist of real words. Cryptic abbreviations are extremely undesirable. Remember that these text attributes are both the user interface to the application and the permanent row and column headers in printed reports. IS shops must do a very professional job of quality assurance on the dimension table attributes.
Step 7: Choosing the Duration of the Database. The duration measures how far back in time the fact table goes. In many businesses, there is a natural need to look at the same time period a year ago. This need usually mandates at least five calendar quarters of data. Near the end of a calendar year, this implies two full years worth of data. These arguments can be repeated with less intensity for two-year-old data, three-year-old data, and so on.
Insurance companies and organizations with regulatory reporting requirements may have very long fact table durations, often extending back seven or more years. These long duration fact tables raise at least two very significant data warehouse design issues. First, it is often increasingly difficult to source old data as you go backward in time. The older the data, the more likely there will be problems in reading and interpreting the old files or the old tapes. Second, it is mandatory that the old versions of the important dimensions be used, not the most current versions. This is known as the Slowly Changing Dimension problem. The proper description of the old product and the old customer must be used with the old transaction history. Often, the data warehouse must assign a generalized key to these important dimensions in order to distinguish multiple snapshots of customers and products over a span of time. I discussed these design issues in my April 1996 DBMS column, " Slowly Changing Dimensions". If you have thought through these issues carefully, then you have accomplished the next step.
Step 8: The Need to Track Slowly Changing Dimensions.
Step 9: Deciding Query Priorities and Query Modes. After the first eight steps, you have a complete logical design of our data mart. You are ready to turn your attention to physical design issues. In this step I restrict attention to the biggest physical design issues affecting the end user's perception of the data mart: the physical sort order of the fact table on the disk and the presence of pre-stored summaries, or aggregations. (Beyond the issues I discuss here are a host of additional physical design issues affecting administration, backup, indexing performance, and security.)
The physical sort order on the disk can be a significant design tool in a data warehouse. In my data warehouse design classes, I discuss a "headquarters sort" and a "field sales sort." The data warehouse designer usually must choose one of these sorts at the expense of the other. In extreme circumstances, the designer can affect data mart performance by a factor of four or more, depending on this choice.
To paraphrase the mathematician Fermat, "It is a pity that the margins of this book are too small to present a complete proof." Rather than waiting for someone else to prove that physical sort ordering affects data mart performance, I promise to address this issue in more detail in an upcoming article.
Stepping back from these two articles, if you systematically perform the nine steps, you will not only end up with a complete and detailed design that drives the implementation, but you will understand how to tie your separate data marts together with conformed dimensions so that over time you will end up with an enterprise data warehouse.
| TABLE 1. Nine-Step Method in the Design of a Data Warehouse
|
| 1. Choosing the Process
|
| 2. Choosing the Grain
|
| 3. Identifying and Conforming the Dimensions
|
| 4. Choosing the Facts
|
| 5. Storing Precalculations in the Fact Table
|
| 6. Rounding Out the Dimension Tables
|
| 7. Choosing the Duration of the Database
|
| 8. The Need to Track Slowly Changing Dimensions
|
| 9. Deciding the Query Priorities and the Query Modes
|
Figure 1.

--A "bad" fact table, with non-numeric facts, non-additive facts, and mixed-up granularity.
Figure 2.

--A "good" fact table in which all of the problems in Figure 1 have been cleaned up.
Figure 3.

--A typical customer billing fact table in which the extended net price can be derived from the other quantities, but nevertheless we want to store it in the table.
Ralph Kimball was co-inventor of the Xerox Star workstation, the first commercial product to use mice, icons, and windows. He was vice president of applications at Metaphor Computer Systems, and is the founder and former CEO of Red Brick Systems. He now works as an independent consultant designing large data warehouses. You can reach Ralph through his Internet web page at http://www.rkimball.com.
This is a copy of an article published @ http://www.dbmsmag.com/


